
Beyond the Urban Wet Island: How Storm Dynamics Dictate City Rainfall
Divergent urban storm response to convective, frontal and tropical systems
This study presents an event-based analysis of over 40,000 warm-season storms in four Texas cities (1995–2017) using 3D radar reflectivity to quantify how urbanization impacts different weather systems. The research reveals that while local-scale convective storms see a significant frequency increase (7–31%), synoptic-scale cold fronts are weakened by 16–28% due to urban surface effects.
TL;DR
For decades, meteorologists have debated whether cities act as "wet islands" or "dry islands." A landmark study published in Nature (2026) by Sui et al. provides the answer: It depends on the storm. By analyzing 40,000 individual storm events in Texas over 23 years, researchers proved that while cities trigger more frequent local thunderstorms, they simultaneously "choke out" and weaken powerful incoming cold fronts.
The "Wet or Dry" Paradox
Urbanization alters the landscape via the Urban Heat Island (UHI) effect and increased surface roughness. However, statistical records of annual rainfall often show contradictory results across different cities. The core issue, as identified by the authors, is that previous research treated all rain similarly. In reality, a local-scale convective cell (driven by surface heat) follows different physics than a synoptic-scale cold front (driven by regional thermal gradients).
Methodology: The 3D Digital Rain Gauge
The researchers utilized GridRad, a three-dimensional gridded radar dataset, to see inside storms. They tracked 40,000 events across Dallas, Austin, San Antonio, and Houston, classifying them based on motion, duration, and intensity.
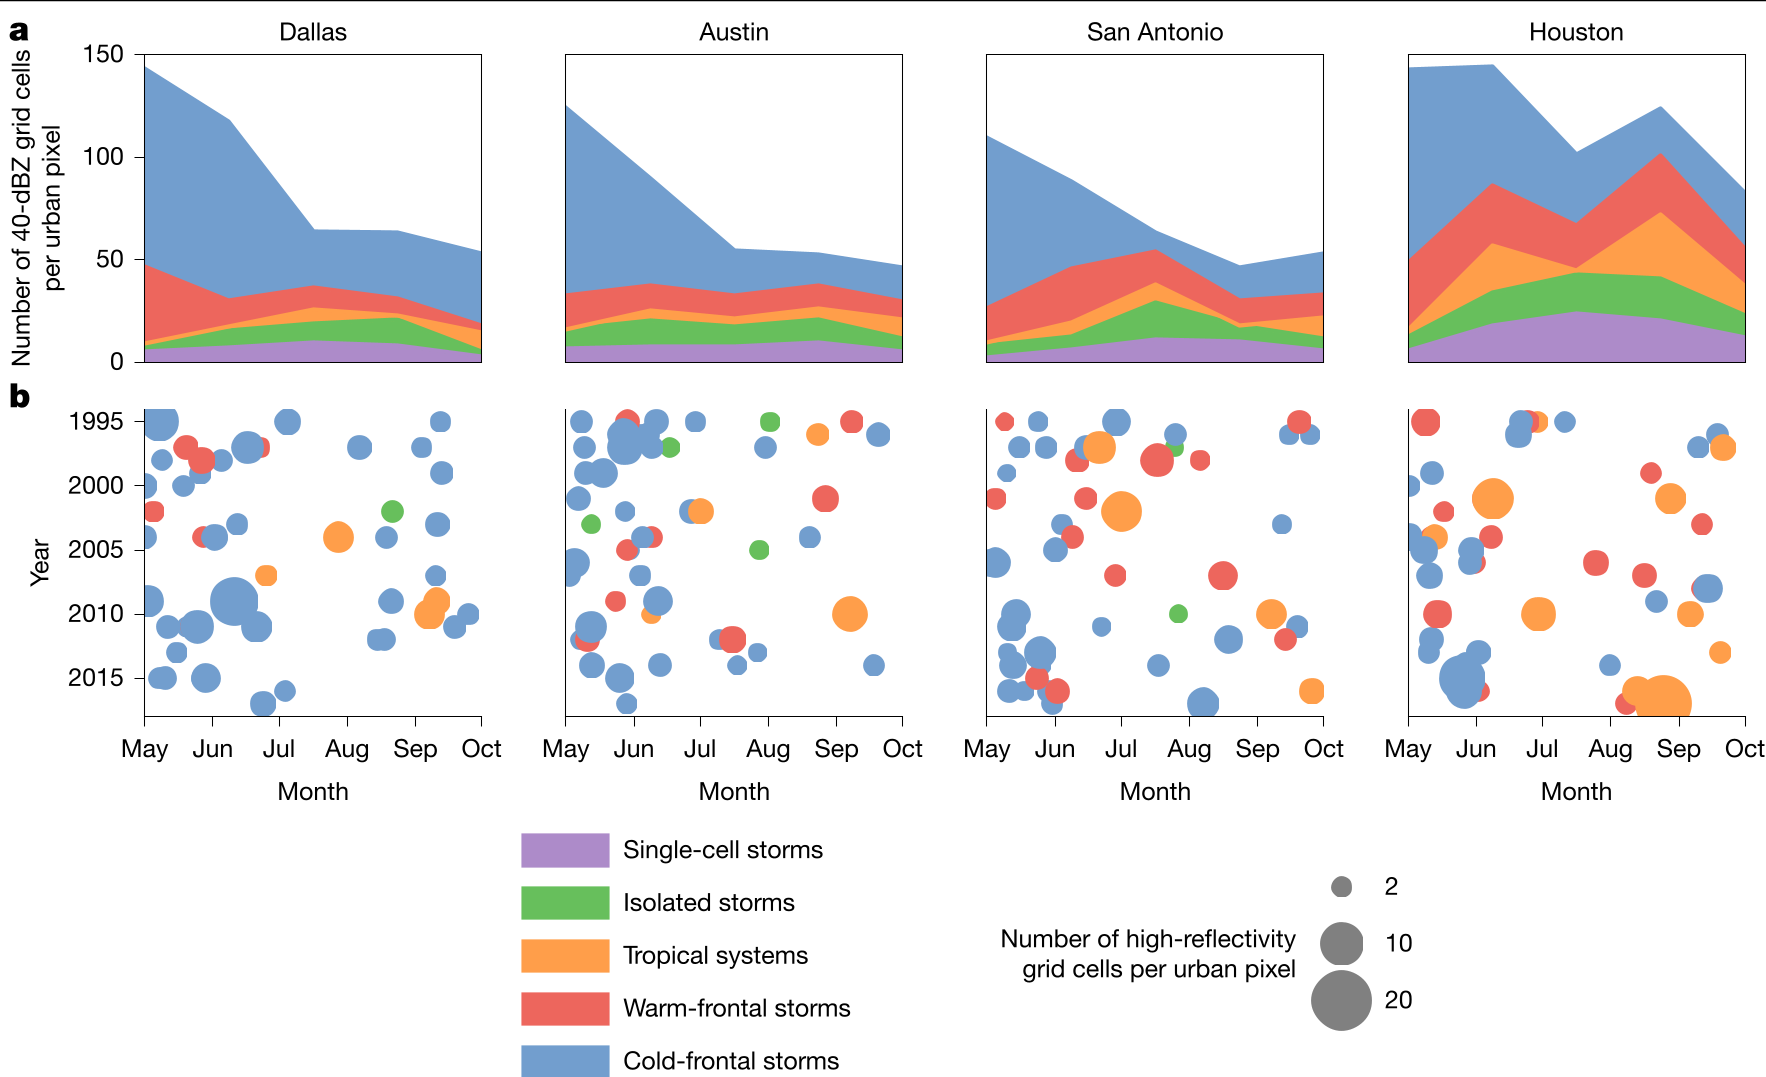 Fig. 1: Storm-type contributions across Texas. Cold-frontal storms represent the largest share of high-reflectivity (heavy rain) grid cells.
Key Insights: Enhancement vs. Suppression
1. Convective Enhancement (The Heat Machine)
Local-scale single-cell and isolated storms showed a marked increase in urban areas.
- Frequency: Up to 31% increase in Houston.
- Vertical Shift: These storms grew taller (by ~500m) and more intense over cities, particularly at night.
- The Why: The UHI enhances atmospheric instability, acting as a "thermal engine" that kicks off convection that might not have triggered in cooler rural surroundings.
2. Frontal Weakening (The Friction Brake)
Surprisingly, cold fronts—the heavy hitters of Texas weather—often lose their punch when they hit the city.
- Intensity: A 16–28% decrease in high-reflectivity grid cells (intensity) was observed over urban centers.
- The Why: As a cold front sweeps over a city, the increased surface roughness (buildings) and urban heat disrupt the lower part of the frontal system, weakening the thermal gradient and reducing the storm's organization.
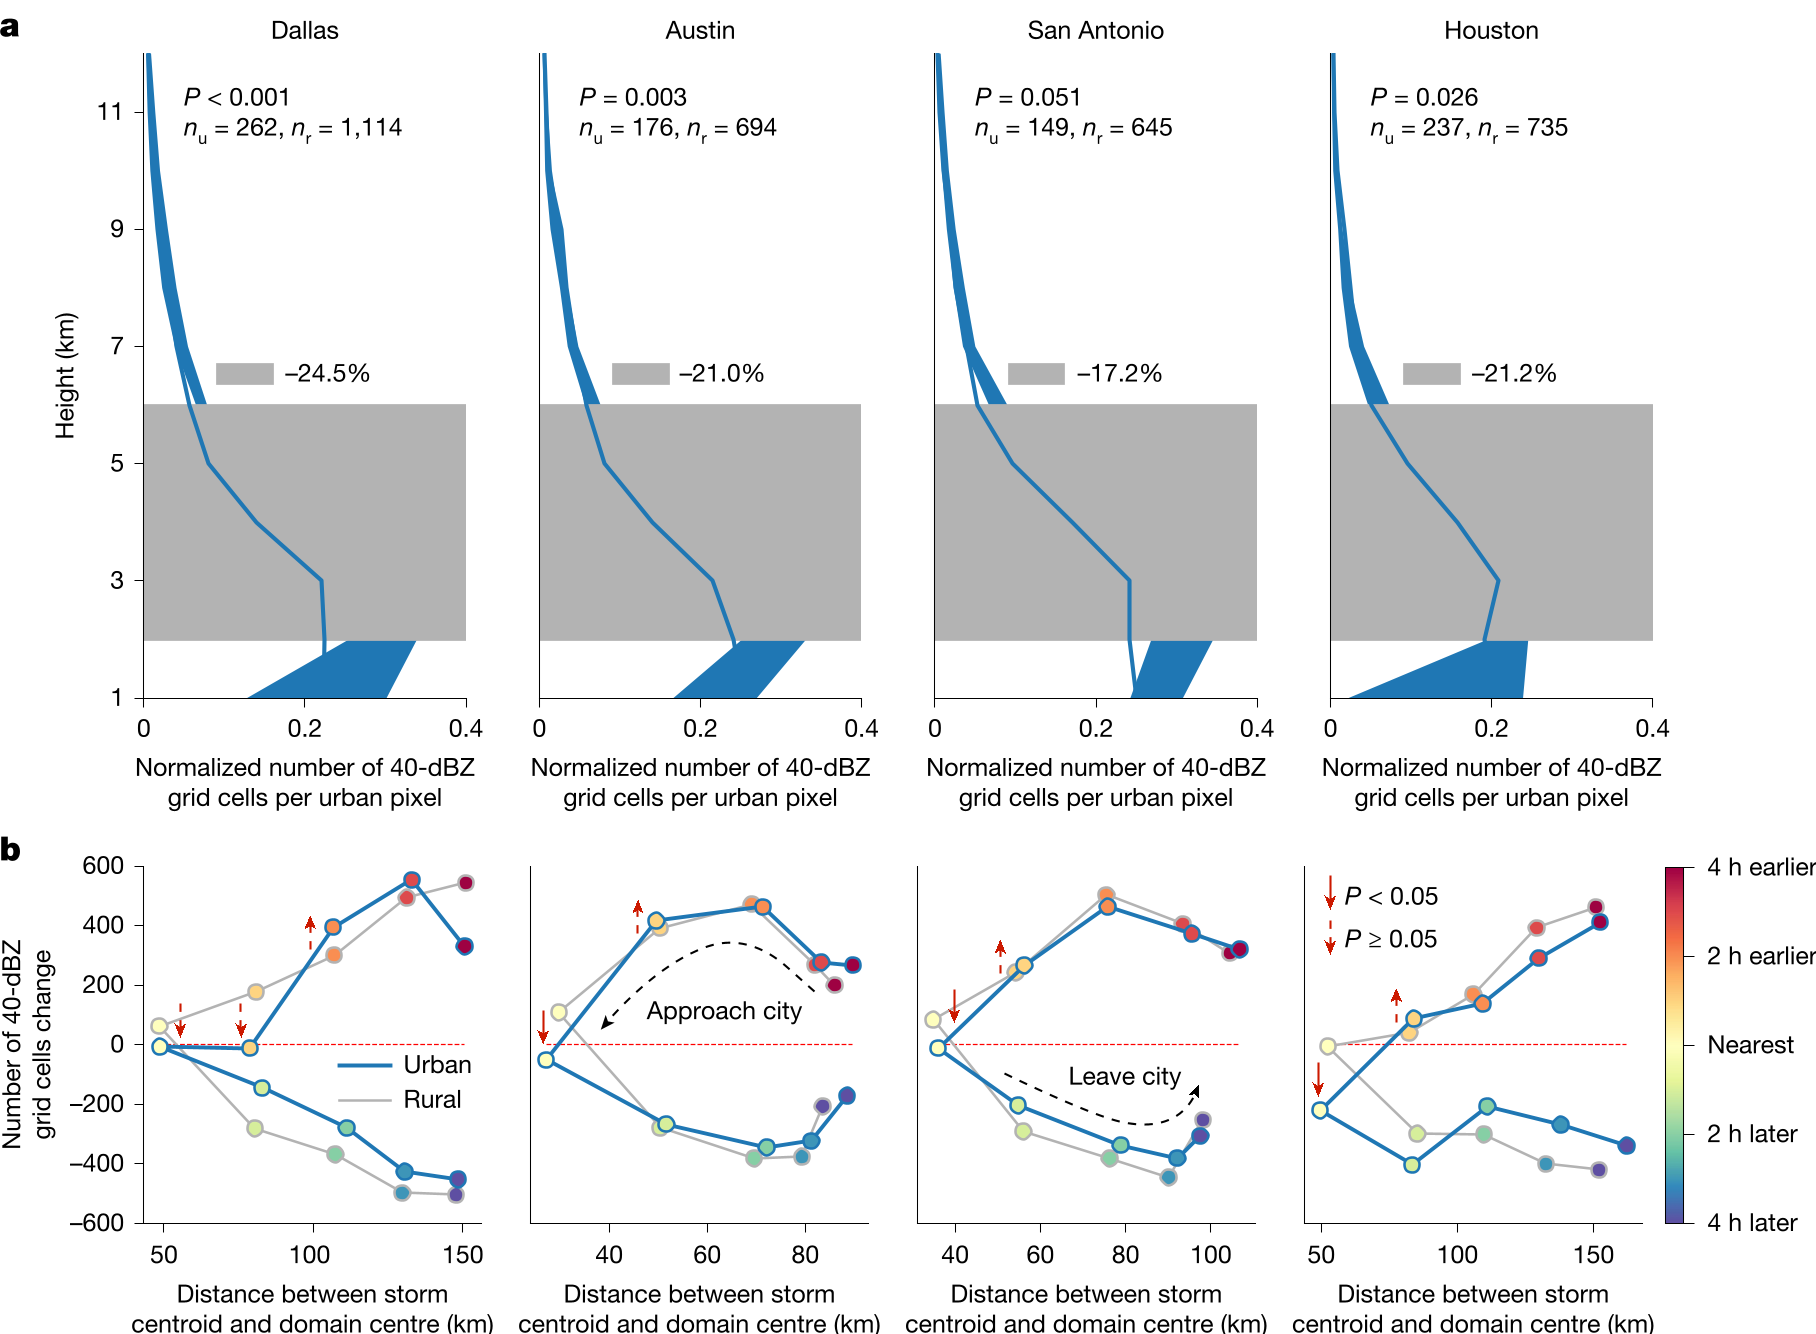 Fig. 2: Vertical profiles showing significantly fewer high-reflectivity grid cells over urban areas (solid lines) compared to rural ranges (blue-shaded areas) for cold fronts.
The Mechanism of "Frontal Disruption"
The study proposes a dual-mode interaction for cold fronts:
- Preparation Phase: As a front approaches, the city’s heat creates a "warmer" path, sometimes slightly intensifying the storm northwest of the city.
- Passage Phase: Once inside the urban canopy, the friction of the buildings and the heat "muddy" the front's clean thermal line, leading to a collapse in rain intensity.
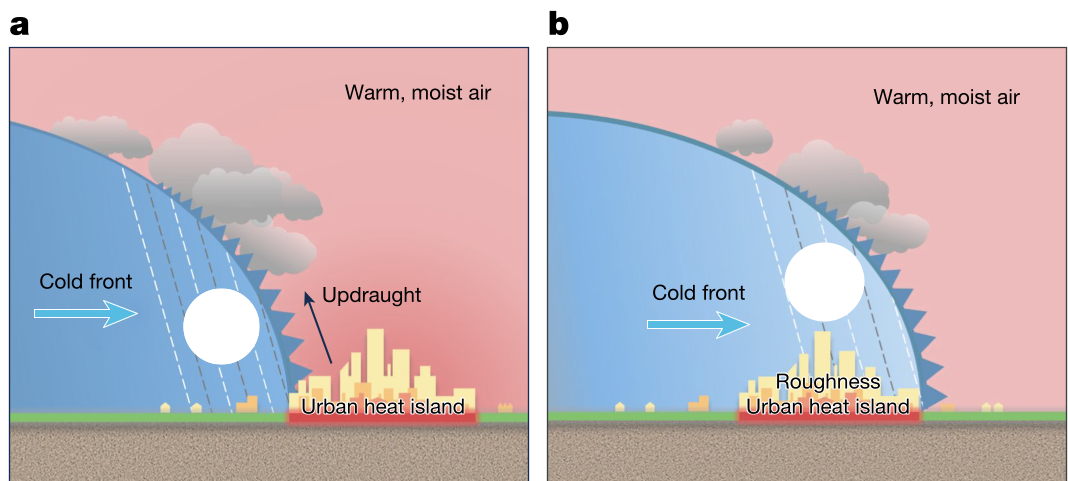 Fig. 3: Conceptual model showing the UHI enhancing the front ahead of the city, followed by disruption and weakening during city passage.
Why This Matters for the Future
As cities grow rapidly, standard infrastructure design (like sewers and drainage) relies on "aggregated rainfall statistics." This paper warns that such broad averages are dangerous. If a city’s growth increases the frequency of short, intense "pop-up" thunderstorms (which cause flash floods) but weakens slower "soaking" fronts, the entire hydrological profile of the region changes.
Takeaway: We must stop asking if cities are "wetter" and start asking which storms are getting stronger. Future urban planning must be as dynamic as the weather systems it faces.
Critical Analysis
While the study is robust for Texas, the authors admit that tropical systems remain a wild card due to small sample sizes (even in 23 years). Furthermore, while the radar data is 3D, it excludes the lowest 1km to avoid "clutter" (reflections from buildings), meaning the very bottom of the storm—where humans live—is still partially inferred.