
The "Panic-Stricken" Factor: Decoding Behavioral Biases via Salience Theory
2022-12-13_方正证券_多因子选股系列研究之八:显著效应、极端收益扭曲决策权重和“草木皆兵”因子
The paper introduces the "Panic-Stricken" (Cao Mu Jie Bing) factor, an enhanced multi-factor stock selection strategy based on Salience Theory. It optimizes traditional reversal factors by weighting daily returns with a "Panic Level" metric to capture investor overreaction to extreme market deviations.
TL;DR
Drawing from Salience Theory, Fangzheng Securities has developed a high-performing "Panic-Stricken" (草木皆兵) factor. By recognizing that investors disproportionately weight extreme stock performance relative to the market, this strategy transforms daily price "noise" into a precise alpha signal. The result? A robust factor with a 32.50% annualized long-short return and a monthly win rate exceeding 85%.
Problem: The Flaw in Equal-Weighted Reversal
Standard quantitative models often treat the return of each day in a 20-day window as equally informative. In reality, a -5% drop when the market is flat is far more "salient" (and thus induces more panic/overreaction) than a -5% drop when the market is down -4%. Traditional reversal factors fail to distinguish between these psychological states, leading to diluted signals.
Methodology: From "Panic" to Factor Construction
The researchers define "Panic Level" (惊恐度) as the degree to which an individual stock's return deviates from the market benchmark (CSI All Share Index).
1. The Core Calculus
The "Panic Level" is calculated as: This formula ensures that when a stock moves independently of the market, it receives a higher weight, simulating the "Salience Bias" of irrational investors.
2. Multi-Dimensional Refinement
The "Original Panic" factor was further optimized through three psychological lenses:
- Volatility Acceleration: Behavioral effects are stronger when intra-day price swings are wild.
- Retail Dominance: Retail investors (trades < 40k RMB) are more prone to emotional "Panic Selling."
- Attention Decay: The impact of a salient event diminishes if it becomes a multi-day norm; the model adjust for recent "average" panic levels to highlight fresh shocks.
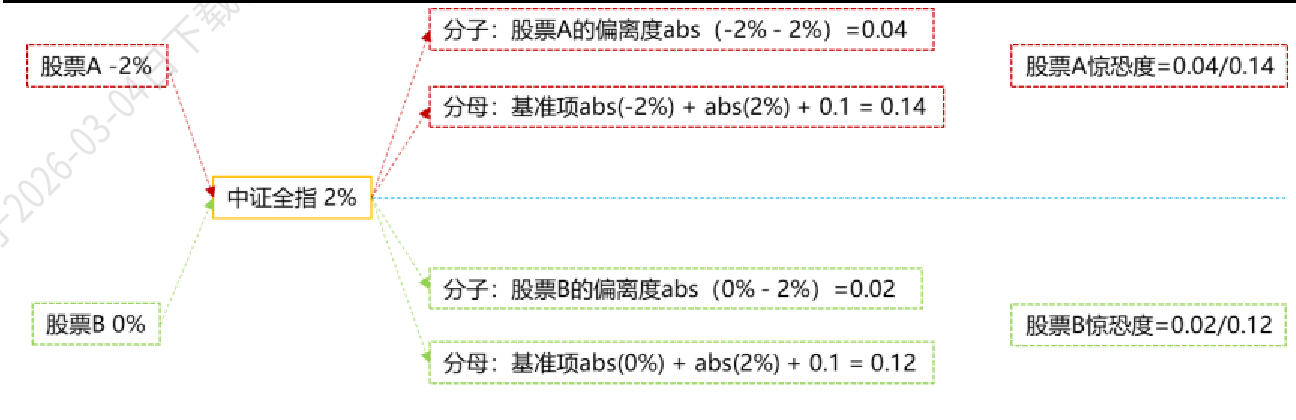 Figure: The transition from raw data to weighted decision scores.
Empirical Results: SOTA Performance
The factor was tested across the A-share market (2013-2022). The "Panic-Stricken" factor outperformed traditional reversal and volatility benchmarks across all key metrics:
| Metric | Traditional Reversal | Panic-Stricken Factor |
|---|---|---|
| Rank IC | -6.69% | -8.90% |
| Rank ICIR | -2.33 | -4.54 |
| Annualized Return | 27.74% | 32.50% |
| Information Ratio | 1.70 | 3.92 |
Grouping Analysis
The factor exhibited perfect monotonicity across ten decile groups, demonstrating strong discriminative power. The top decile (Long) significantly outperformed the broader indices like the CSI 300 and CSI 1000.
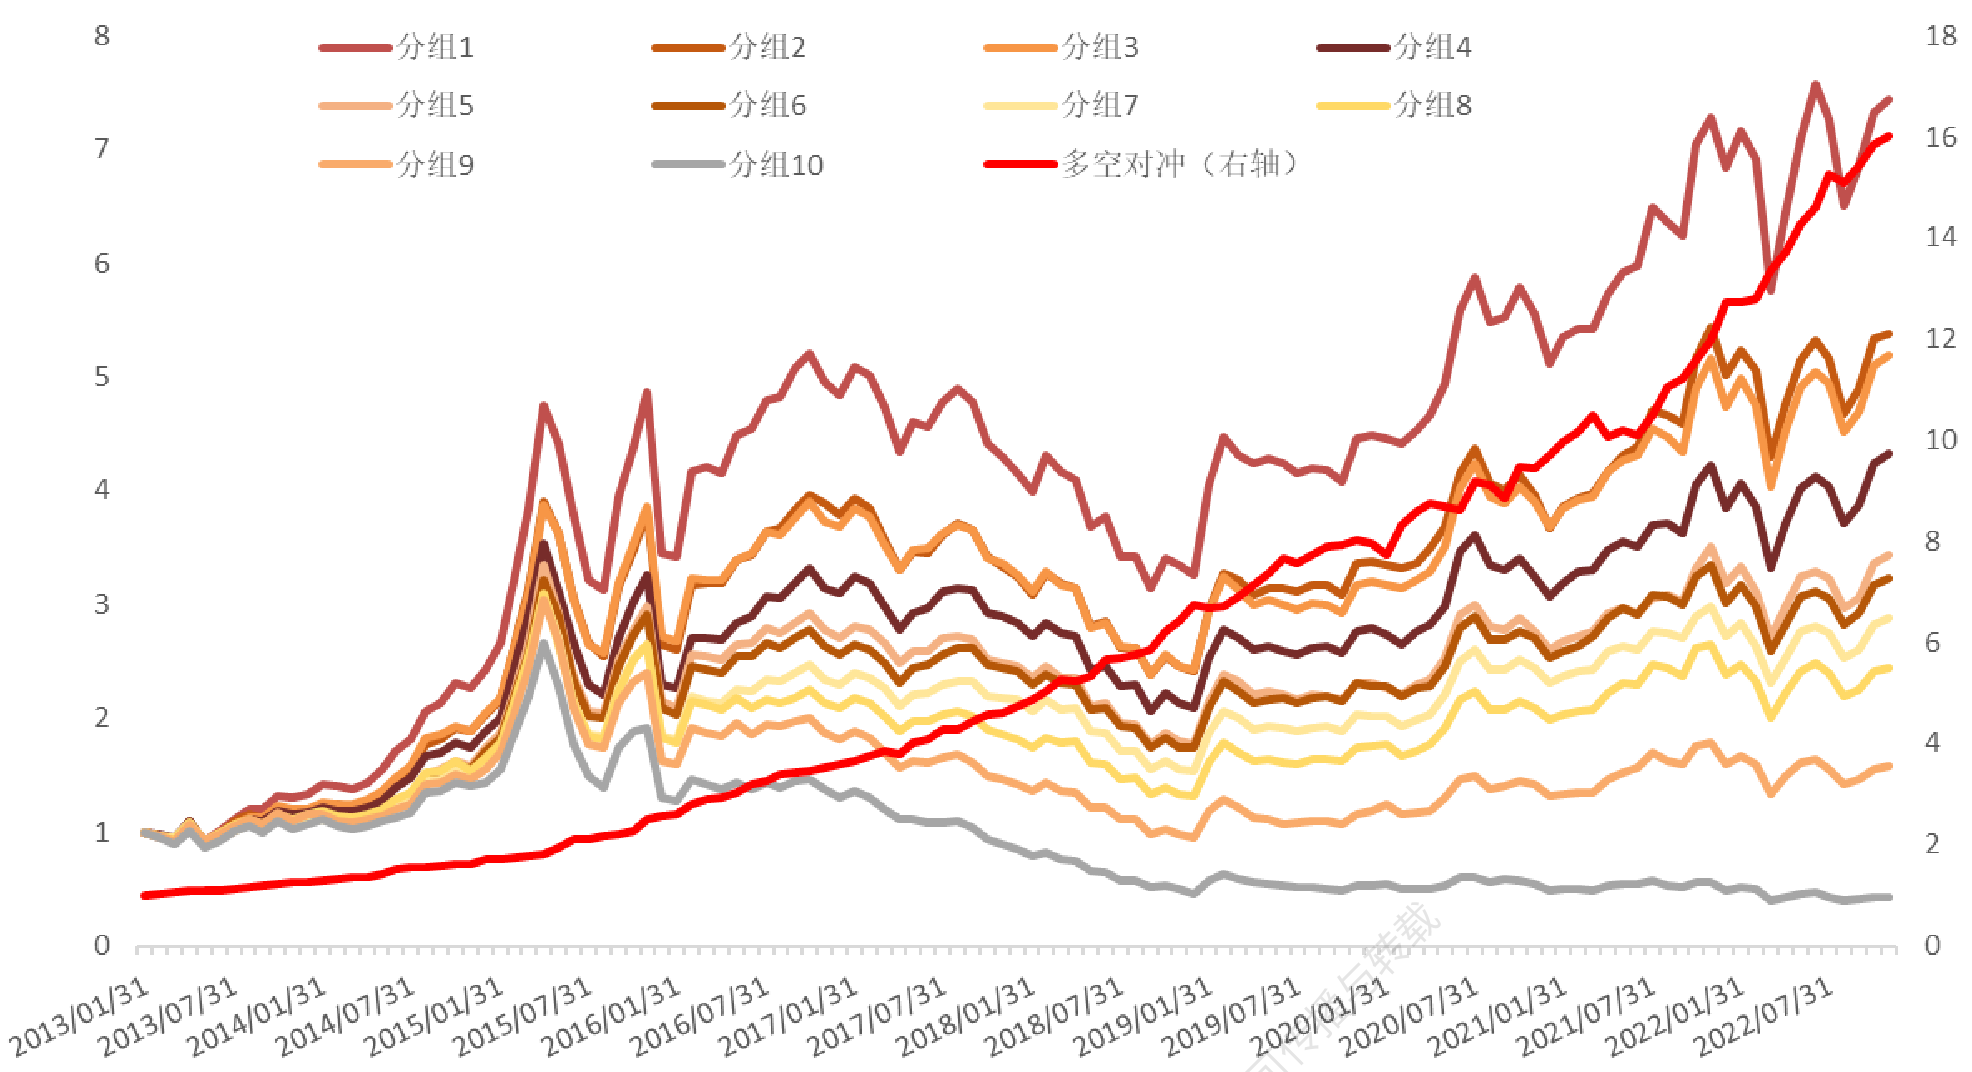 Figure: Cumulative returns and long-short equity curve.
Critical Insight: Why it Works
The "Panic-Stricken" factor succeeds because it identifies forced or emotional liquidity provision. When retail investors panic and sell stocks that have deviated sharply from the market, they create a temporary price vacuum. The factor systematically bets on the "mean reversion" of these overreactions.
The model’s performance in the CSI 1000 (Annualized Excess Return: 10.15%) vs. the CSI 300 (7.42%) confirms the hypothesis: Salience effects are more potent in small-cap stocks where retail participation is higher and market efficiency is lower.
Conclusion & Future Outlook
While the monthly factor is powerful, the authors note that weekly rebalancing pushes the annualized long-short return to a staggering 58.79%. This suggests that the "Panic" signal has a high decay rate, characteristic of behavioral alpha.
Limitations: Transaction costs for weekly rebalancing can be high. Future research should focus on optimizing the trade-off between signal decay and execution slippage.