
Hotspot Reaction: Profiting from the Divergence of Market Attention and Price
2025-03-12_方正证券_多因子选股系列研究之二十二:股票舆情热度的反转效应与“热点反应”因子构建
This report introduces the "Hotspot Reaction" factor, a quantitative equity selection strategy that combines "Hotspot Drift" and "Hotspot Reversal" metrics. It leverages high-frequency stock popularity data to capture individual investor attention and market overreaction, achieving a steady weekly IC of 5.08% and an annualized ICIR of 7.34.
TL;DR
This research by Founder Securities moves beyond simple sentiment analysis to decode the "Hidden Language" of market attention. By constructing the Hotspot Reaction factor—a blend of attention drift and extreme sentiment reversals—the authors achieved an impressive 85.21% weekly win rate and 20.05% annualized long-short returns, proving that the most valuable signals occur when investor hype and stock prices move in opposite directions.
Problem & Motivation: The Noise in the News
Quantitative analysts have long struggled with news sentiment. Why does a "Positive" sentiment score often lead to a price drop? The authors identify three fatal flaws in traditional approaches:
- Low Signal-to-Noise Ratio: Keyword-based algorithms often map general industry hype (e.g., "Robotics") to specific stocks that have no actual involvement.
- The Momentum Trap: In bull markets, high-popularity stocks exhibit persistent momentum, causing contrarian "Salience" factors to fail.
- Pricing Speed: By the time an LLM scores a news piece, the market has often already fully priced the information.
To solve this, the researchers utilized high-frequency, structured "Stock Heat" data from THS (Tonghuashun), focusing not on what is being said, but on how investor attention is shifting.
Methodology: From Drift to Reversal
1. Hotspot Drift (The Steady Signal)
The "Hotspot Drift" factor calculates the normalized weekly average of daily absolute changes in stock popularity. It captures the gradual buildup or exhaustion of investor interest.
- Insight: Extreme attention surges often lead to overpricing (short signal), while a sharp drop in attention might signal an oversold opportunity for "smart money" to collect chips (long signal).
2. Hotspot Reversal (The Shock Signal)
The researchers identified "Abnormal Popularity" events—moments where attention fluctuates more than 5 standard deviations from the mean.
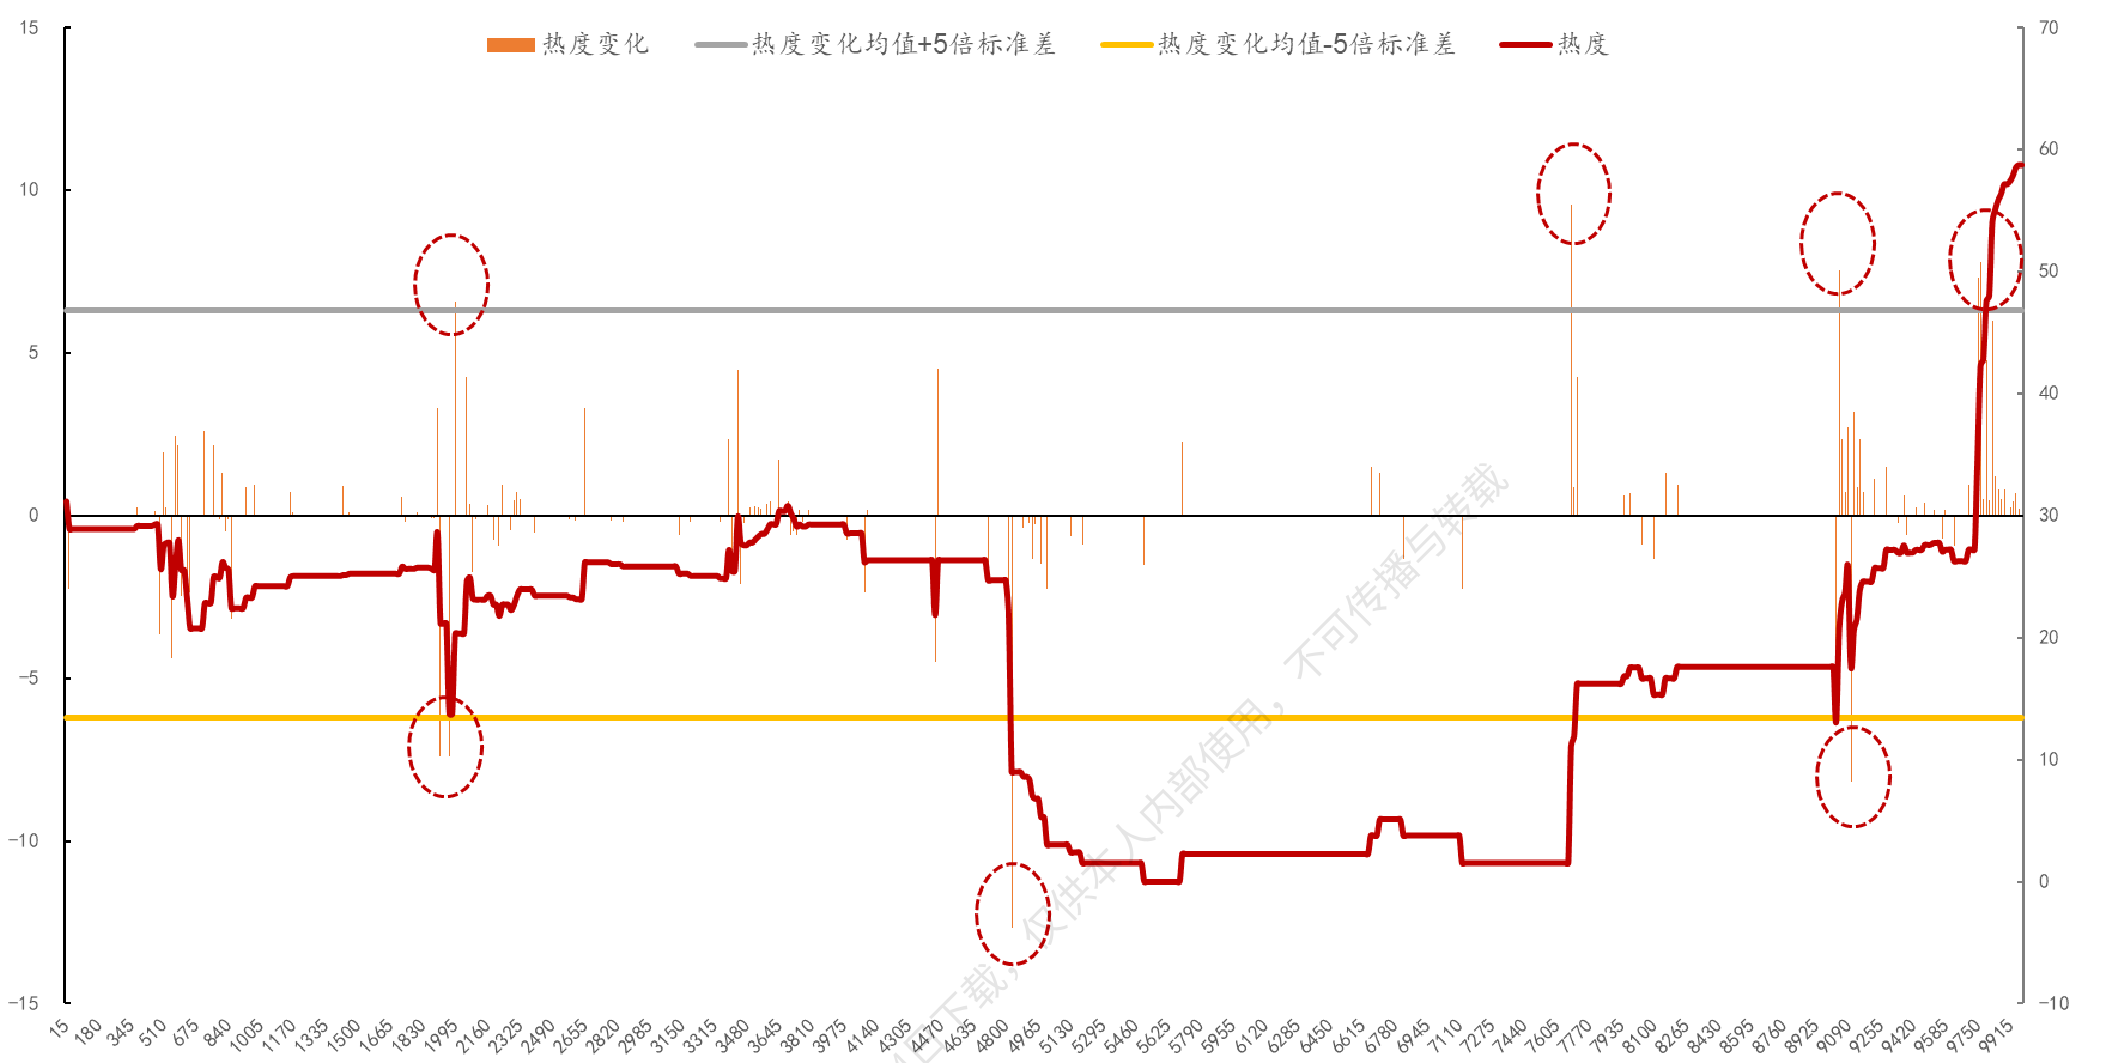
They categorized these shocks into four scenarios based on price-attention divergence:
- The Divergence Play: The strongest Alpha was found when Popularity Rises but Price Falls (suggesting potential bottoming/absent selling pressure) and when Popularity Rises but Price Rises Excessively (suggesting a bubble-like overreaction).
3. The Hotspot Reaction Factor (Synthesis)
By combining Drift and Reversal with equal weights, the "Hotspot Reaction" factor was born, designed to capture both the gradual erosion of alpha and sudden sentiment-driven mispricing.
Experiments & Results: Robustness Across the Board
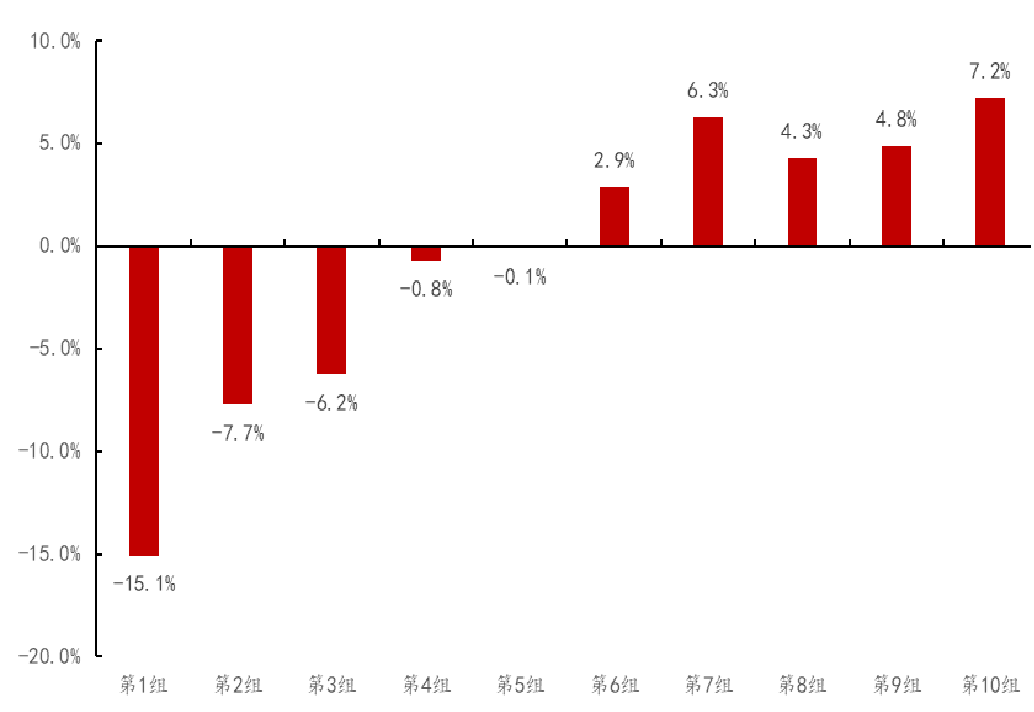
The factor demonstrates remarkable stability. Unlike the previous "Salience Effect" factor, which flattened during the late 2024 market rally, the Hotspot Reaction factor stayed resilient.
- IC Performance: Weekly IC mean of 5.08% with an ICIR of 7.34.
- Style Independence: Low correlation with Size, Value, and Liquidity factors (most correlations ), although it shows a slight overlap with Residual Volatility ().
- Market Coverage: Effective across Large-caps (CSI 300) and Small-caps (CSI 1000), proving it is a universal behavioral anomaly.
Deep Insights & Conclusion
Takeaway
The core value of this research lies in its Contrarian Logic. It treats retail investor attention as a "resource" that, when over-consumed or misaligned with price, creates a predictable rubber-band effect.
Critical Analysis
While the factor is robust, the authors acknowledge that "keyword aggregation" in data can still introduce noise (e.g., the "Robotics" tag bias). Future improvements could involve using LLMs to filter the cause of the heat surge before applying the quantitative reversal logic.
Future Outlook
As the cost of LLM inference drops, the next frontier will be merging this "Attention Heat" data with real-time semantic analysis to distinguish between "Rational Heat" (driven by fundamentals) and "Irrational Heat" (driven by meme-culture), further refining the signal.