
Decoding the Iceberg: Predicting Hidden Liquidity in CME GLOBEX Futures
Prediction of Hidden Liquidity in theLimit Order Book of GLOBEX Futures
This paper introduces an online pattern recognition and nonparametric kernel estimation algorithm to detect and predict "iceberg" orders—a type of hidden liquidity—on the CME GLOBEX futures exchange. By analyzing the micro-latency and sequence of LOB updates following trade events, the method achieves SOTA-level predictive accuracy for total hidden volume in high-frequency trading environments.
In the high-stakes arena of high-frequency trading (HFT), the Limit Order Book (LOB) is traditionally viewed as the ultimate map of market intentions. However, the existence of "hidden" orders—specifically Iceberg Orders—means that what you see is often not what you get.
This research provides a rigorous framework for unveiling these hidden intentions, proving that through careful analysis of micro-structure latencies and statistical priors, the "invisible" 12% of market volume can be brought into the light.
TL;DR
Traders use iceberg orders to hide large volumes, displaying only a small "peak" to avoid market impact. This paper presents an algorithm that:
- Identifies icebergs by detecting LOB refreshes within 300ms of a trade execution.
- Predicts the remaining hidden volume using a bivariate Gaussian kernel density distribution learned from historical data.
- Validates that in the e-mini S&P 500, icebergs are vastly larger (12x) than normal orders and constitute 12% of total executed volume.
The Problem: The "Ghost" in the Machine
In an "open" LOB, transparency is the goal. However, informed traders use icebergs to minimize market impact. If a trader wants to sell 1,000 contracts, showing them all at once would crash the price. By using an iceberg, they show only 10 at a time.
From a liquidity provider's perspective, this is a nightmare. You might think the market is balanced, but there is a massive sell-side wall lurking just behind the display. Prior works have used regression or Bayesian models, but they often struggle with the real-time, high-latency constraints of exchanges like GLOBEX.
Methodology: Pattern Recognition meets Statistical Priors
The authors' core insight is that while an iceberg's presence is hidden, its replenishment is a deterministic signal.
1. The Detection Signal (The "How")
When a trade fills the visible "peak" of an iceberg, the exchange (GLOBEX) automatically sends a refresh message to put the next tranche in the book. The algorithm scans for:
- An order submitted within dt = 300ms of a trade.
- Orders occurring at the best price level (m=1) where the trade happened.
- Non-implied, explicit order updates.
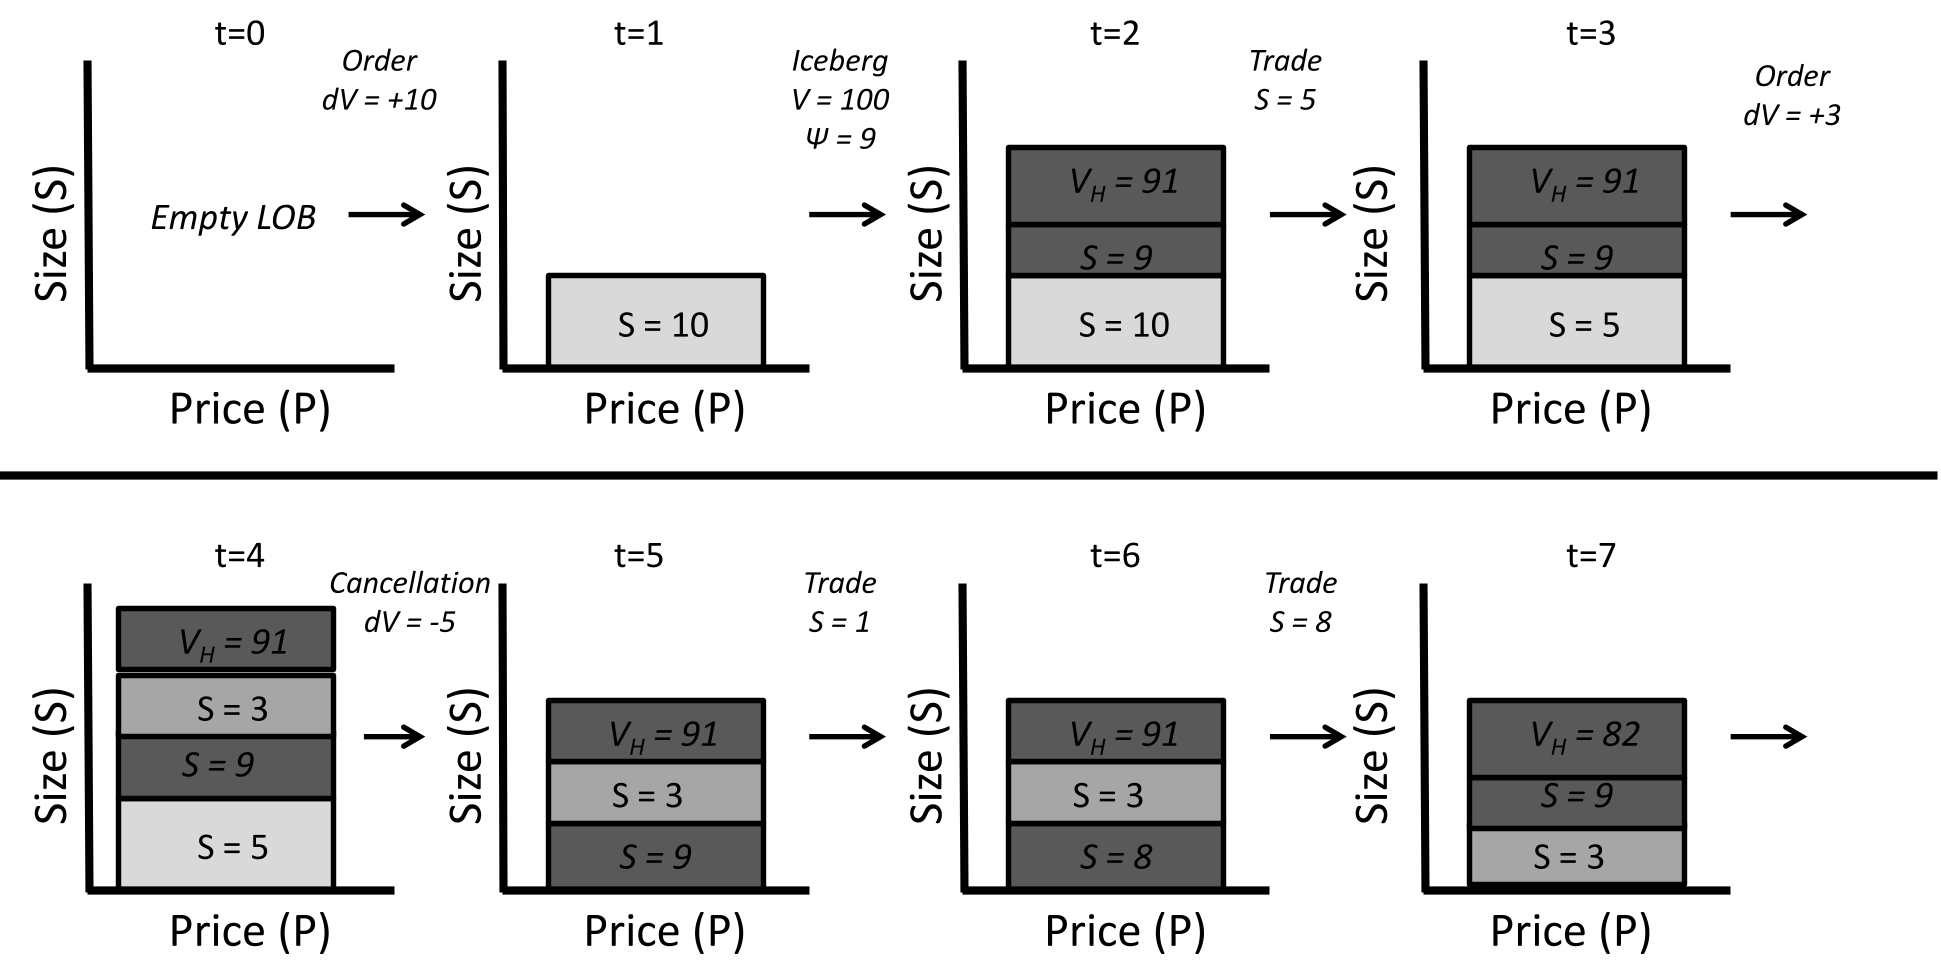 Figure 1: Updated exhibit showing how peaks lose time priority and move to the back of the queue on GLOBEX.
2. The Prediction Engine (The "Probability")
Once an iceberg is identified, the algorithm needs to guess: "How much more is left?" It uses Bivariate Gaussian Kernel Density Estimation to create a map of typical iceberg behaviors. It turns out human traders exhibit bias—often choosing "round" numbers for their total volumes (e.g., 50, 100) and peak sizes. The algorithm exploits these repetitive patterns to maximize the conditional probability of the estimated total size given the observed peak .
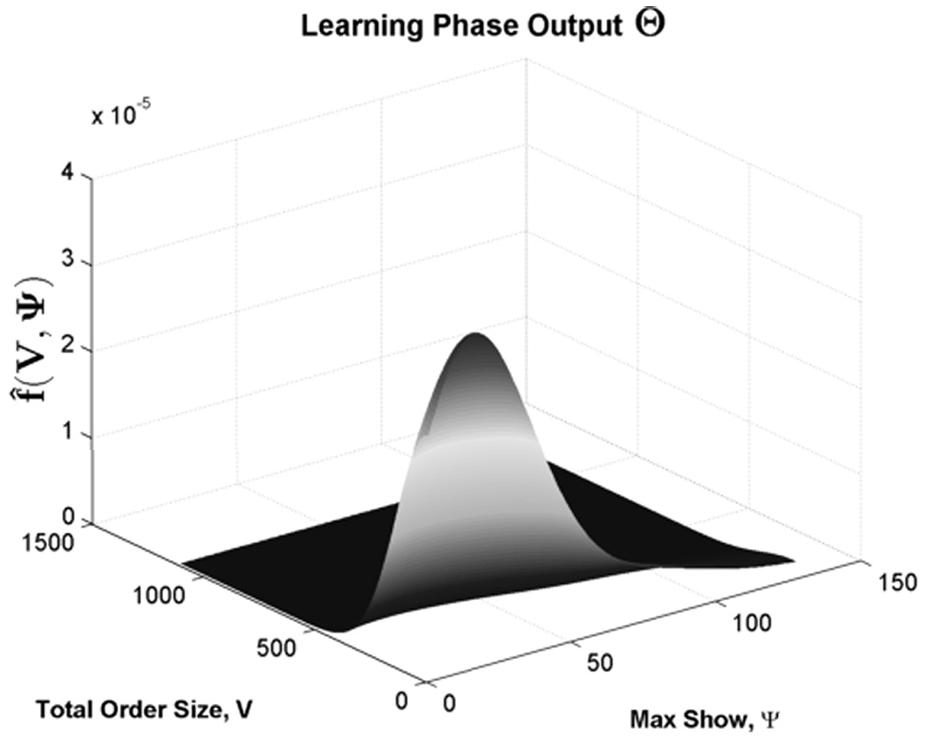 Figure 2: The joint distribution Θ learned from historical data, showing clusters of common iceberg configurations.
Experimental Results: Quantitative Superiority
The algorithm was tested on the E-mini S&P 500 (ES) futures—one of the most liquid contracts in the world.
- Scale: Icebergs represent 3.2% of limit orders but a staggering 12% of executed volume.
- Accuracy: In predictive benchmarks, the proposed algorithm (Experiment I) maintained a stable and low error rate throughout the order's lifecycle, whereas naïve or random models failed catastrophically.
- Alpha Potential: By accounting for hidden volume, the error in "Weighted Bid-Ask Ratios" (a common proxy for price direction) was reduced by over 1%. In the world of HFT, a 1% edge is a fortune.
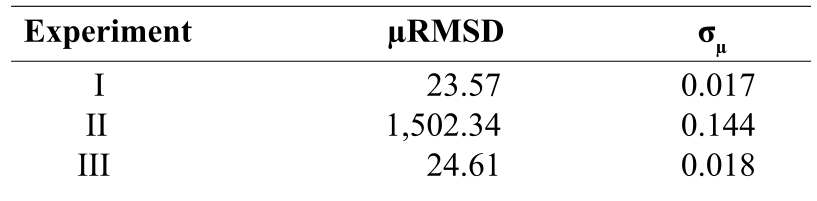 Figure 3: Benchmark results showing Experiment I (the proposed algorithm) outperforming random and static baselines.
Critical Insight & Conclusion
The most fascinating takeaway is the human element. Despite being an "algorithmic" market, the kernel density plots revealed distinct "spikes" at round numbers (10, 25, 40 tranches). This human bias is exactly what makes the hidden volume predictable.
The Limitation: The algorithm mainly detects icebergs at the inside price (Level 1). If an iceberg is sitting deeper in the book and the price never reaches it, it remains invisible.
Future Outlook: The authors suggest that to remain truly hidden, traders must randomize their "Max Show" values. Until exchanges enforce or automate this randomization, the "invisible" tranches of the market will continue to be a source of alpha for those with the latency and logic to find them.