
Spectral-Domain Local Statistics: Solving the Missing Data Puzzle in Cartesian and Polar Grids
Spectral-Domain Local Statistics with Missing-Data Support for Cartesian and Polar Grids
This paper introduces a spectral-domain framework for computing local statistics (mean, variance, and standard deviation) on incomplete gridded data using boundary-aware operators. By unifying Discrete Cosine Transform (DCT) for reflective Cartesian boundaries and Real Fast Fourier Transform (RFFT) for periodic polar coordinates, the method achieves O(N log N) efficiency while mitigating wrap-around artifacts.
Executive Summary
TL;DR: Researchers from the University of Colorado Boulder have developed a high-efficiency framework to calculate local mean and variance on incomplete datasets—common in radar and satellite imagery. By leveraging the Discrete Cosine Transform (DCT) for reflective boundaries and RFFT for periodic azimuths, they effectively eliminate the "wrap-around" artifacts that plague standard Fourier methods, all while maintaining computational complexity.
Positioning: This work serves as a critical bridge between theoretical signal processing (Normalized Convolution) and practical geoscience applications, providing a robust, open-source tool (dct_toolkit) for real-time quality control and outlier detection.
The Problem: When Missing Data and Edges Collide
In fields like meteorology, data is rarely "clean." Beam blockage in radar, cloud cover in satellite passes, and sensor failures leave "holes" (missing values) in grids. Standard smoothing techniques face a double-edged sword:
- Complexity: Local spatial windows become prohibitively slow as window size increases.
- Boundary Artifacts: Switching to the spectral domain (FFT) usually assumes the data repeats infinitely (periodicity). In a non-periodic field—like a temperature gradient—this creates massive errors at the edges as the "hot" right side bleeds into the "cold" left side.
The authors’ core insight is that we can treat "missingness" as a certainty mask and use specialized spectral transforms that "know" about the physical boundaries of the grid.
Methodology: Specialized Transforms & Normalized Convolution
The framework treats local statistics as a ratio of two spectral filters. To compute the local mean , the method filters the masked data () and the mask itself () separately:
1. Boundary-Aware Operators
The choice of Transform defines the boundary physics:
- Cartesian Grids: Uses DCT-II, which implies a reflective (mirror) boundary. This is ideal for most physical fields where the value at the edge should project naturally outward.
- Polar Grids (Radar): Uses a hybrid approach. The range axis uses DCT (reflective), while the azimuth axis uses RFFT (periodic) to account for the wrap-around.
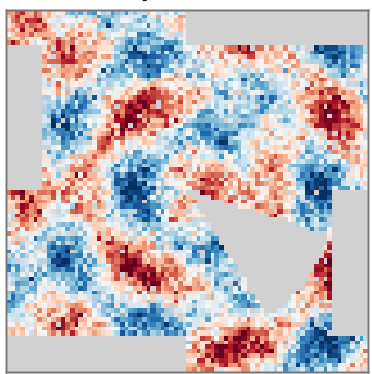 Figure 1: The pipeline logic. By smoothing the mask alongside the data, the model precisely understands how much "support" (actual data) exists behind every pixel.
2. Adaptive Polar Kernels
Unlike Cartesian grids, polar grids "stretch" as you move further from the center. The authors implement adaptive azimuth kernels that widen or narrow based on the range index to ensure a consistent physical smoothing area across the entire radar scan.
Experiments & Results
The "Wrap-Around" Fix
Testing on a 1D synthetic signal with a trend, the team compared reflective DCT against periodic FFT.
- The Result: Periodic FFT produced massive spikes at the edges (Error +561%). Reflective DCT tracked the local trend accurately.
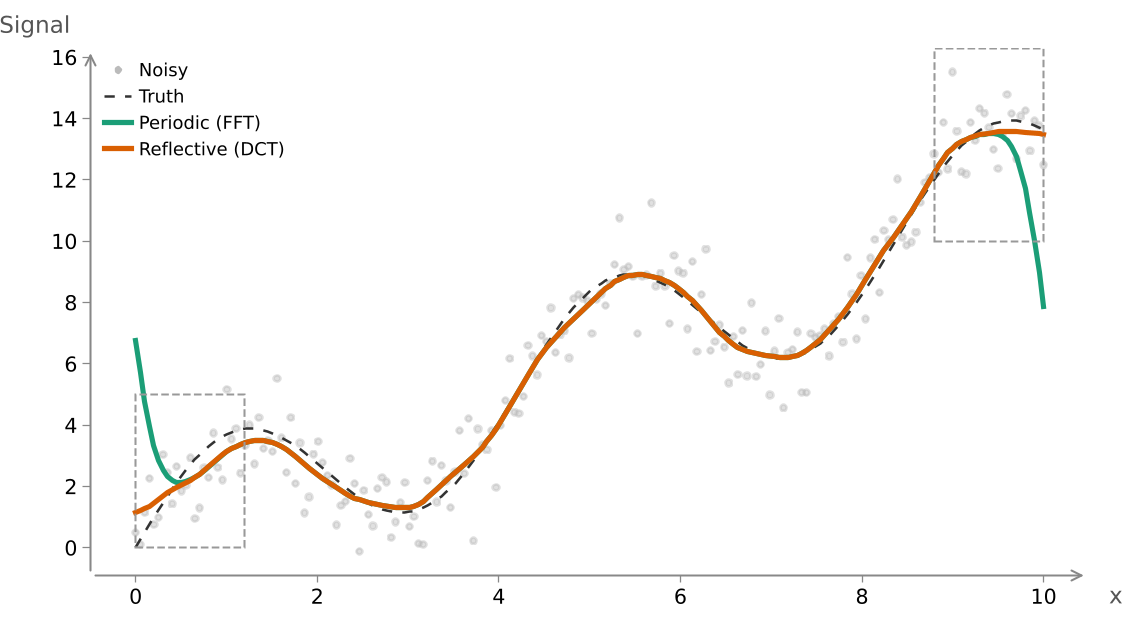 Figure 2: Note how the periodic FFT (blue line) is "pulled" by the opposite edge, whereas the reflective DCT (red line) respects the local slope.
3. Outlier Identification in Cyclones
The team simulated a 3D cyclone wind field and injected random outliers. Global statistics fail here because the inherent "swirl" of a cyclone creates massive variance that masks individual outliers. Using Local Z-Scores (calculating deviation relative to the local and ), they achieved high precision and recall (F1-score of 0.84 at ).
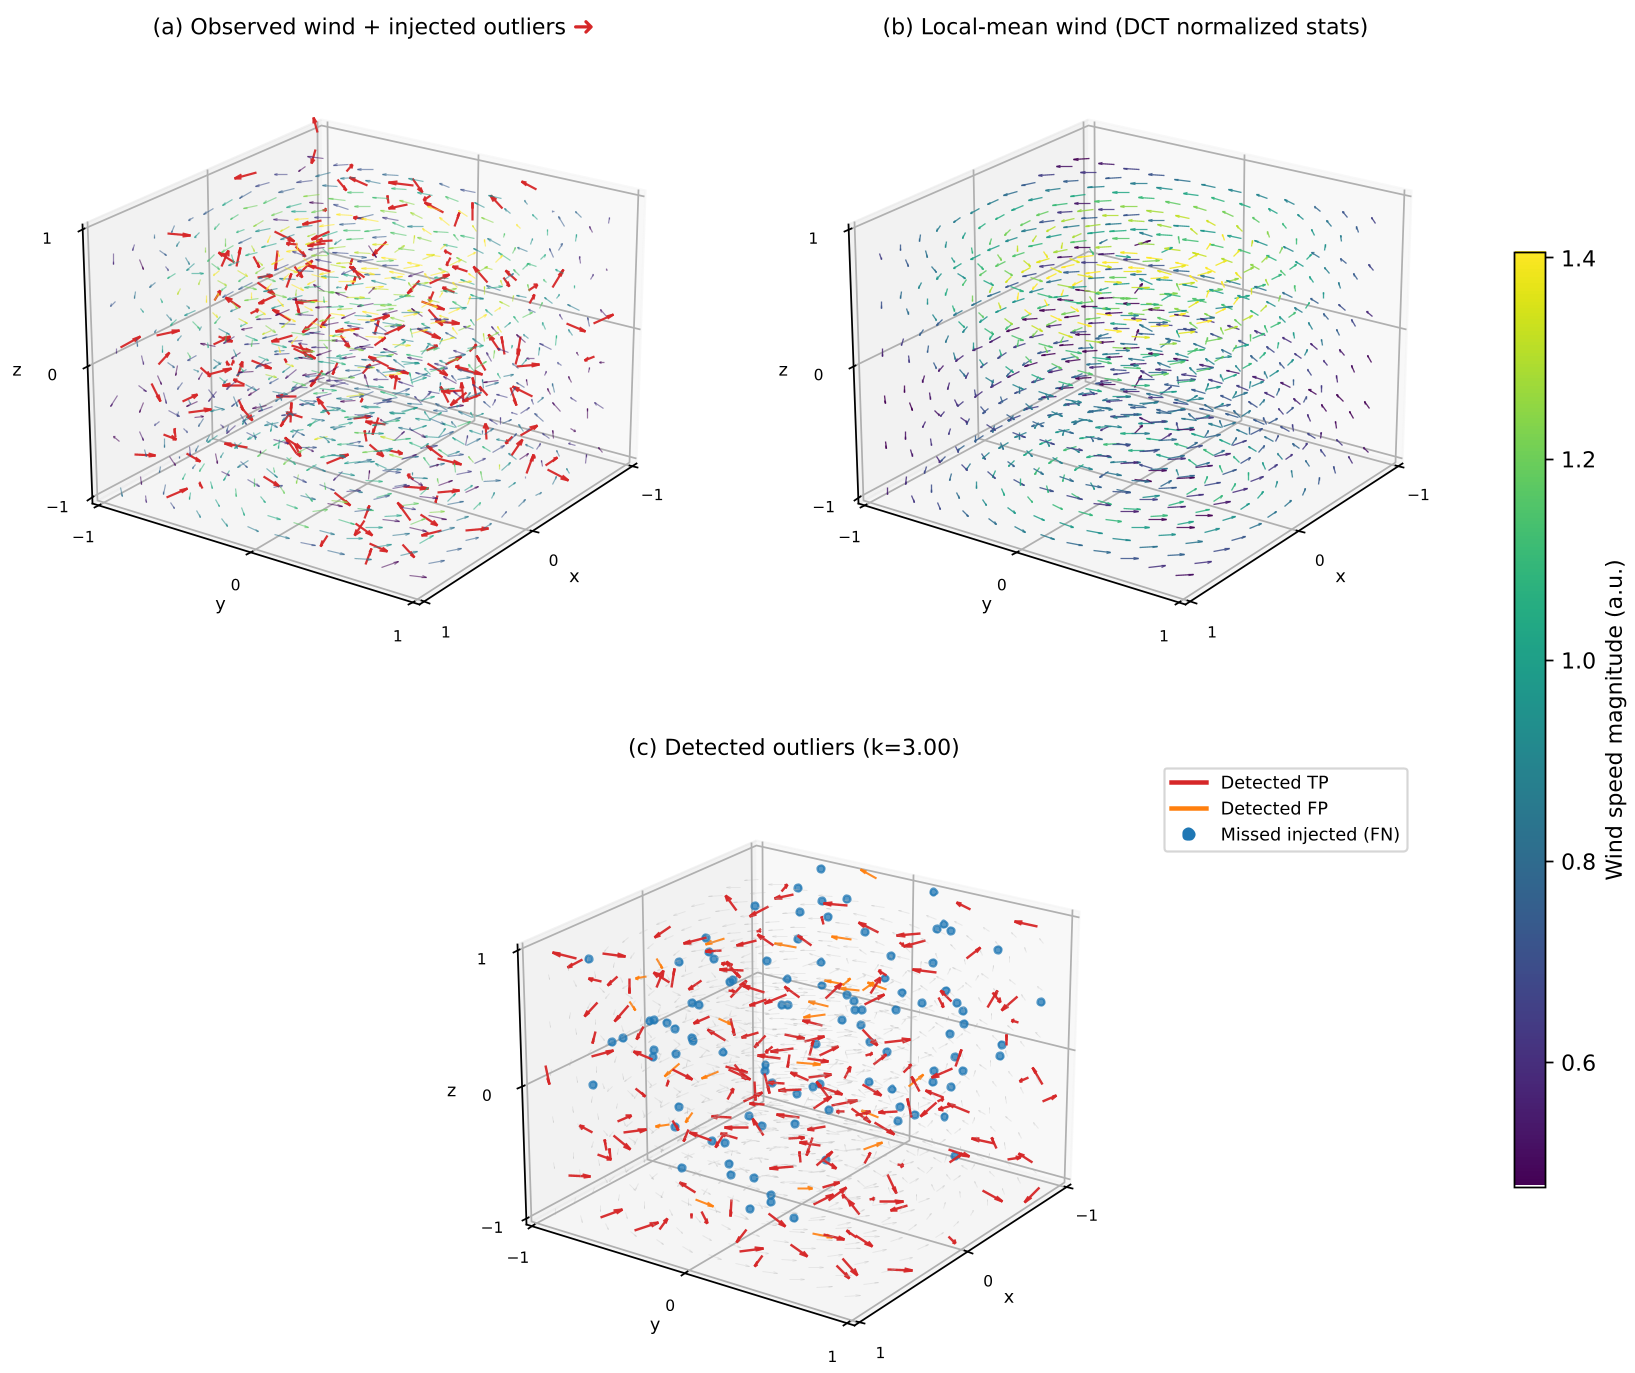 Figure 3: Detection of outliers in structured flow. Local normalization allows the system to distinguish between a "naturally" fast wind in the eyewall and a "sensor error" outlier.
Critical Insight & Conclusion
The true value of this work lies in its stability safeguards. When dealing with "low-support" regions (areas with very few valid data points), the authors don't just return a NaN or a zero; they implement a "denominator floor" and an "iterative prefill fallback." This ensures that the algorithm remains numerically stable even in highly obstructed radar sectors.
Limitations: The method relies on the choice of threshold and kernel width . In regions with very few samples (), the variance estimates can still be "noisy" regardless of numerical stability.
Future Outlook: This framework is a prime candidate for integration into automated QC pipelines for the next generation of phased-array radars and high-resolution climate modeling.